Track Your Fleet with Precision and Clarity
Our GPS tracking and dashcam solutions provide real-time insights and enhanced safety for your vehicles. Stay informed and in control, ensuring efficiency and security on every journey.
Solutions by Industry
Linxup is focused on residential and business service companies with mobile and fixed assets in the field like vehicles, equipment, trailers, and tools.


Solutions by Product
Discover our innovative GPS tracking and dashcam solutions designed to improve your fleet's safety and efficiency.
Solutions by Use Case
Whether your business is looking to improve visibility, safety, customer service, efficiency, or compliance, we have the right solution for you.

Seamless integrations with the tools you use currently.









Father and Son Pest & Lawn Solutions replaced outdated tracking with Linxup to manage a growing fleet of 30+ vehicles. Real-time GPS and dashcams improved driver behavior, reduced risk, and provided proof of service to resolve customer disputes.
GPS tracking and dashcams give Father and Son Pest & Lawn real-time visibility, safer drivers, and clear proof of service.
How Linxup Helped a 30+ Truck Fleet Cut Risk and Prove Every Job


The Junkluggers of Gainesville uses Linxup GPS and Safety Scores to monitor driver behavior, improve accountability, and reinforce safe driving across its fleet of large trucks. Daily scorecards keep performance transparent, while safety is tied directly to coaching and profit sharing. The result is safer operations, stronger accountability, and better control over risk and costs.
With real-time tracking and Safety Scores, The Junkluggers of Gainesville builds accountability, reduces risk, and ties safe driving directly to performance and pay.
How Junkluggers of Gainesville Turned Driver Safety into a Daily Scorecard with Linxup

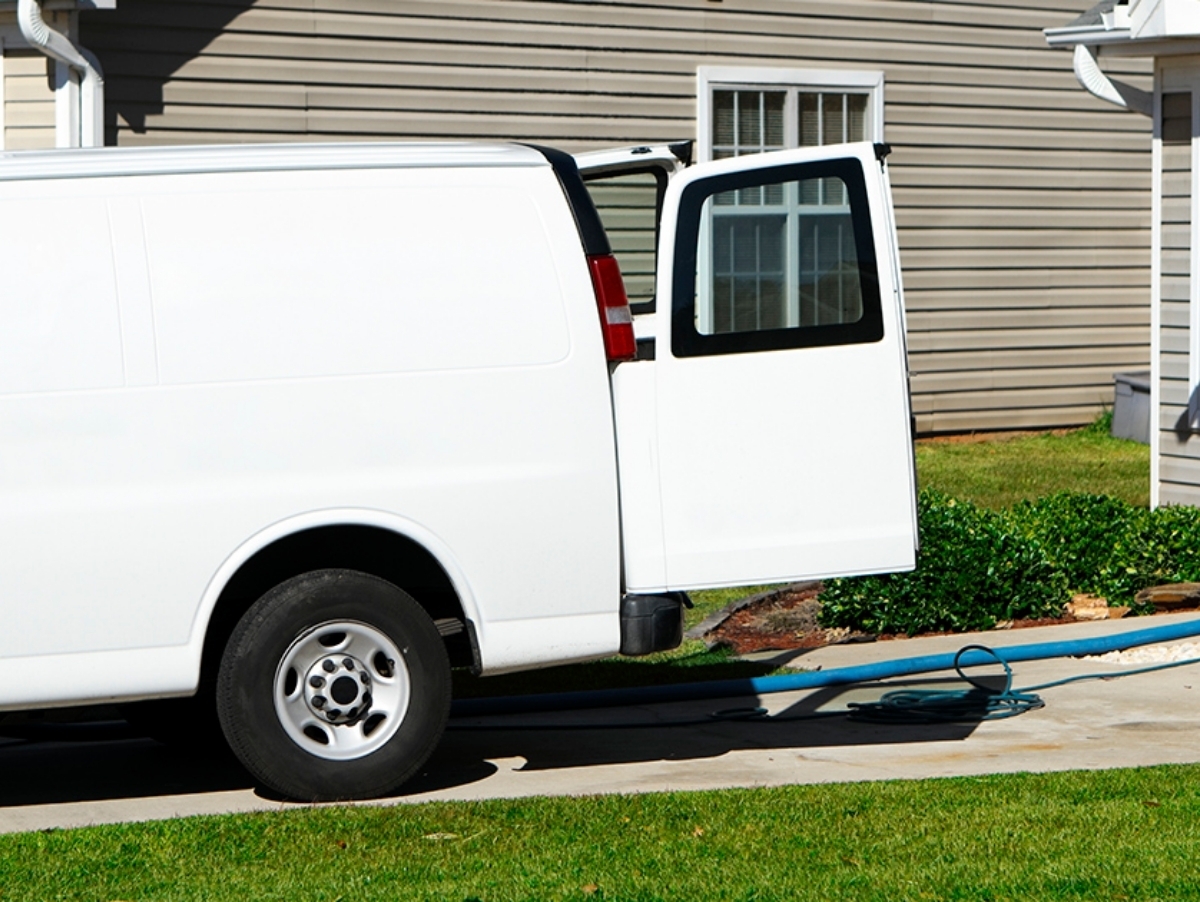
CSI-Absolute Clean Inc. uses Linxup to monitor technicians in real time, ensuring accurate arrival times, better communication, and stronger accountability. When customers challenge service timing, GPS data provides immediate proof and resolves disputes on the spot. The system also helps reduce idle time, control fuel costs, and keep crews moving efficiently.
From customer disputes to crew accountability, Linxup gives real-time proof that protects time, money, and reputation.
How GPS Tracking Became CSI-Absolute Clean Inc.'s Secret Weapon

FAQs about Fleet Management and Tracking Solutions
These are some common questions business owners have about fleet management and tracking solutions and how they can help their business.
- Reduced idle and unproductive time, per the DOE/Argonne idling-cost data above — time and fuel wasted on unnecessary idling is time not spent generating revenue.
- Better asset utilization visibility — knowing which vehicles are underused helps rightsize the fleet rather than carrying idle capital.
- Maintenance planning grounded in real usage data (engine hours, mileage) rather than calendar-based guessing, which ATRI's cost-per-mile maintenance benchmarks suggest is a meaningful cost lever.
- Compliance efficiency — ELD integration and automated mileage/jurisdiction tracking reduce administrative burden tied to FMCSA reporting requirements, freeing staff time for other work.
- Faster dispatch decisions, since real-time location removes guesswork about which tech is actually closest to a new job.
- Data-driven driver coaching, replacing anecdote-based management with documented behavior patterns (speeding, harsh braking, idling) tied to safety and cost outcomes.
- Idling is a large, well-documented source of fuel waste. The U.S. Department of Energy and Argonne National Laboratory estimate that idling wastes roughly 6 billion gallons of gasoline annually in the U.S., costing an estimated $11 billion in fuel. Reducing idle time — through visibility, alerts, and driver coaching — is one of the most direct, controllable fuel-cost levers a fleet has.
- Fuel is a large share of operating cost. ATRI's operational cost research tracks fuel as one of the largest per-mile cost components for commercial fleets, meaning even modest percentage improvements translate to meaningful dollar savings at fleet scale.
- Detention and unproductive wait times add up. ATRI's detention research has found a substantial share of stops involve extended wait time at job sites or facilities, during which vehicles often idle unnecessarily — a pattern GPS/idle-time data can surface and correct.
- Route optimization reduces total miles driven and the associated fuel burn, particularly relevant for trades doing multiple same-day service calls.
- Maintenance costs track with driving behavior. ATRI publishes per-mile repair and maintenance cost benchmarks; harsh driving and excessive idling accelerate wear, so reducing them also reduces this cost line, not just fuel.
More accurate ETAs. Real-time location data lets dispatch give customers a narrower, more reliable arrival window instead of a half-day block — a common pain point for homeowners waiting on trade services.
- Faster dispatch of the nearest available technician. Knowing which vehicle is actually closest (not just scheduled closest) reduces response time for same-day or emergency calls.
- Fewer missed or double-booked appointments, since dispatchers can see real vehicle status and location rather than relying on a tech's self-reported progress.
- Better first-time fix rates, indirectly — asset/equipment tracking features can confirm a truck is stocked with the right parts before it's routed to a job.
- Documentation for service disputes. Time-stamped arrival/departure data can resolve "the tech was never here" or "they were only here for five minutes" disputes.
For SMB field service businesses — HVAC, plumbing, electrical, landscaping, pest control — a fleet management solution gives owners and dispatchers visibility they otherwise don't have once a vehicle leaves the lot. The core, well-established benefits are:
- Cost control. Fuel and maintenance are typically the largest controllable operating expenses for a service fleet. The American Transportation Research Institute (ATRI) tracks these as ongoing components of per-mile operating cost in its annual operational cost studies, and telematics-driven visibility into idling, routing, and vehicle health is a documented lever for reducing them.
- Safety. Real-time visibility into speeding, harsh braking, and driving patterns supports coaching conversations grounded in data rather than anecdote. The National Safety Council (NSC) and NHTSA publish ongoing research on commercial driving risk factors that fleet managers can use to prioritize coaching.
- Compliance. For fleets operating vehicles subject to Hours of Service or ELD rules, FMCSA sets the compliance framework; fleet management platforms that integrate with ELD systems reduce manual logging burden and audit risk.
- Asset utilization and theft deterrence. GPS visibility helps identify underused vehicles and supports faster recovery in theft cases — the National Insurance Crime Bureau (NICB) publishes annual vehicle theft data that's a useful backdrop when making this case internally.
- Operational accountability. Location and time-stamped data reduce disputes over arrival times, job duration, and unauthorized vehicle use.
Challenges, per U.S. Department of Energy/Argonne National Laboratory research on fleet electrification:
- Charging infrastructure gaps, especially for larger commercial vehicles. Argonne's ongoing work with the EVs@Scale consortium notes that current charging technology doesn't yet meet the power levels or short charging-window needs of larger commercial vehicles.
- Range anxiety and route planning complexity when mixing vehicle types with different range profiles across a service territory.
- Total cost of ownership modeling gets more complex — DOE's Argonne lab has built tools like TechScape specifically to help fleets quantify true TCO, emissions, and energy savings differences across electric, hybrid, and plug-in hybrid options, which suggests this is a genuinely hard calculation, not a simple one.
- Fragmented data across powertrain types, since fuel-based and electric vehicles are typically monitored differently (fuel card data vs. charging session data), making unified reporting harder.
Emerging solutions: - Federal infrastructure investment: the National Electric Vehicle Infrastructure (NEVI) program, part of the Infrastructure Investment and Jobs Act, is funding a national public charging network — relevant context for fleets weighing EV/hybrid adoption timelines.
- Telematics platforms that normalize data across fuel and electric vehicles into a single reporting layer, so idle time, utilization, and cost-per-mile stay comparable across a mixed fleet.
Route and duty-cycle analysis before adoption, to match vehicle type to route range/duty requirements rather than fleet-wide mandates.
Still have questions?
We're here to help you!