What Is Geofencing and How Does It…
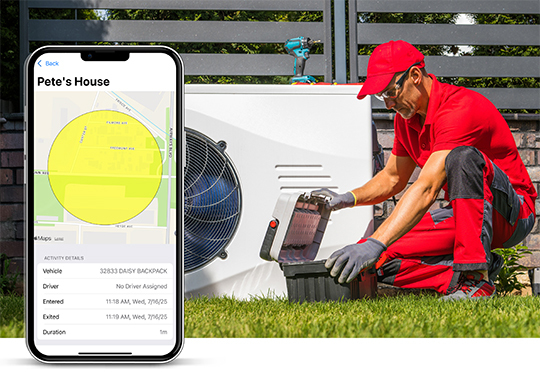
Quick BreakdownGeofencing lets you draw a virtual boundary around any job site, yard, or customer property and…

Quick Breakdown
|
Fleet safety sounds simple until you try to manage it.
Most fleet managers want safer drivers, fewer incidents, and lower insurance costs. What they usually lack is time, direction, clear data, and buy-in from the crew. In our 2025 survey, 31 percent of fleet managers said they do not even know where to start with driver coaching — let alone how to do it successfully.
That gap is where safety programs fall apart.
With GPS tracking, AI-powered dash cams, and documented coaching, even small fleets can now run a real safety program without hiring another manager or staring at spreadsheets all day. Linxup’s Safety Score and Driver Leaderboard are built to make driver behavior measurable, visible, and fair. Everything you need to see is right in front of you, not buried in data or guesswork.
This is about giving owners and managers a clear way to reduce risk and coach drivers without turning safety into a fight.

The Linxup Safety Score turns driving behavior into a simple grade from A to F. Think of it like a report card.
With Linxup, you decide what matters most to your business, so managers can track specific critical fleet safety metrics. That might be speeding, harsh braking, rapid acceleration, or idle time. When you add AI dash cams, you can also include phone use and tailgating.
Each behavior is scored on its own. Those scores roll up into a weighted average based on the priorities you set. The result is one clear safety score per driver that reflects how they actually drive on the job.
These metrics line up with how insurance companies look at risk. They don’t just take a snapshot once a year. They study trends over time in your telematics reports and loss runs to see if drivers are getting safer or slipping the wrong way. That matters because you’re not just improving safety for your own operation. You’re tracking the same behaviors carriers and brokers use to set and negotiate your premiums at renewal.
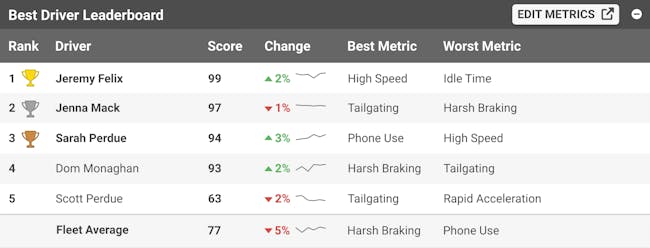
The Linxup Driver Leaderboard gives operators and fleet managers full visibility into how drivers stack up against each other using the same scoring criteria for everyone.
It gives managers a fast way to spot top performers or drivers who need coaching. Drivers see where they stand and what they need to improve. There's no guessing and no favorites.
When paired with the Driver Coaching Dashboard and Coaching Sessions, the leaderboard becomes a tool for consistent, ongoing improvement. Not a once a year safety talk that everyone forgets.
You control which behaviors matter most. Focus on speeding, harsh braking, tailgating, or fuel waste depending on your operation.
Drivers know exactly how they are being measured. That transparency builds trust and cuts down on pushback.
Your driver scorecard reflects real risk factors insurers care about, like speeding, hard braking, distracted driving, and how well you stay on top of maintenance. Strong coaching and driver retention can support lower premiums over time.
See exactly what happened to cause a score drop, not just that it did. Spot trends, identify coaching opportunities, coach faster, and track improvement over time.
The Safety Score and Leaderboard work in sync with the Linxup Driver Coaching Dashboard to deliver regular, data-backed feedback. Using objective metrics, you can clearly show how telematics platforms improve driver safety with honest conversations and consistent coaching.
Fleet managers are already using Safety Score as a core part of their safety programs.
The Junkluggers of Gainesville operates large, fully loaded trucks in busy metro areas. For them, unsafe driving is not just a stat. It is a risk to their brand, their finances, and their people.
Owner Mark Harrington puts it plainly:
“So far, I love it. For me, safety is the number one thing. If the trucks are driven in an unsafe manner, it's bad for the brand; you get phone calls to the call center. I let the guys know it's not that Big Brother is watching, it's that we are being a safe company with a five ton truck rolling down the road.”
That framing matters. Safety works best when drivers understand the why.
Setup is straightforward. You can find step-by-step instructions on our Help Page. The real work is deciding what you want to improve. Every fleet is different but we suggest you start with one alert, and build from there. You might focus on harsh braking first. Another fleet might focus on speeding or idle time. Set your alert types and weightings to match your risks.
Be clear with drivers from day one. Share how scores are calculated and how they will be used. Transparency drives buy-in.
Most importantly, treat the leaderboard as a coaching tool, not a trap.
Use it to:
When data becomes a bridge instead of a weapon, safety improves and tension drops.
The Linxup Safety Score and Driver Leaderboard help fleets build safer driving habits, recognize top performers, and reduce risk across the business. Over time, this approach can also support lower insurance costs.
Book a free demo to see how Linxup can help you lower driving risk and bring more transparency to your fleet.
Here are answers to common questions about the Safety Score and Leaderboard to show how telematics platforms make driver safety clear and measurable with a transparent scorecard.
This is configurable, so you can add or remove any of the available metrics. Available metrics include: High Speed, Rapid Acceleration, Harsh Braking, Posted Speed, Phone Use, and Tailgating.
Please note: Phone Use and Tailgating require an AI Dash Cam to be installed in your vehicles.
Yes, you can adjust the metrics that make up your score and the individual metric weight settings.
We recognize how important seatbelt use is for protecting field workers and, it is on our roadmap for future updates. For launch, we prioritized behaviors that directly increase the likelihood of an accident or incident occurring. Seatbelt use does play a critical role in reducing injury severity and improving driver safety overall. For that reason, we plan to incorporate it in the future.
Event types, weightings, and calculations are backed by safety research and shaped by the same priorities insurance companies use to assess risk.
Each alert type gets a 0-100 score and a corresponding grade. The overall score is a weighted average of the enabled alert types. The grading scale is standardized, so it’s familiar for your team and easy to implement (90-100 = A, 80-90 = B, etc.)
This is somewhat specific to the fleet and your safety program and goals, but we created a standardized, familiar grading scale so you can really think of an A is an A, a B is a B, etc. They should strive for A's and B's but also focus on and reward incremental improvements over time, especially if a driver is struggling with a specific risk like cell phone use.